
A Definition : A science that deals with aetiology, distribution, and control of disease in groups of relatives and with inherited causes of disease in populations (Morton, 1982). Note that this is double barrelled, but information about populations is inferred via correlations observed among samples of relatives.
| Molecular epidemiology |
| Human genetics |
| Clinical genetics |
| Cancer genetics |
| Biochemical genetics |
| Molecular biology |
| Genomics |
| Bioinformatics |
| Statistical genetics |
| Evolutionary and population genetics |
The human genome is made up of 3.1 billion nucleotide pairs arranged linearly in chromosomes. Human cells are diploid, that is, there are two complete sets of chromosomes (23 pairs of autosomes and two sex chromosomes), one originating from each parent.
There are 23000-25000 genes: these comprise directly transcribed sequence (exons and untranslated regions) 1.9% of the genome, and intronic DNA (36% of genome). Approximately 5% of the genome is segmental duplications.
A germline mutation (error in replication of DNA) occurs every 1 Mbp per generation. Cross species comparisons suggest there are approximately 4 coding mutations per genome per generation, one third of which will be deleterious.
Mutation gives rise to 0.8 polymorphic sites per 1000 base pairs in human populations: a polymorphism is a location (locus) in the sequence where 1% or more of individuals carry a nucleotide different from the rest of the population. Alleles are the different variants at the locus.
| Satellite repeat |
| Minisatellite repeat |
| Variable Number Tandem Repeat |
| Simple Sequence Repeat: includes microsatellites |
| Indel: Insertion/deletion of short or long sequence |
| Transversion: Single Nucleotide Polymorphism |
Build 123 of dbSNP (30/10/04) contains data for 10,079,771 SNPs
| Mechanism | Number in HGMD |
|---|---|
| Nonsynonymous coding variants | 40228 |
| Affecting splicing | 4668 |
| Affecting transcription level | |
| Affecting DNA binding | 599 |
| Distant enhancers |
In three surveys of allelic-specific transcription, 20-40% of genes have been found to contain noncoding variants that alter gene expression level.
Recombination occurs during meiois, and involves randomly cutting and rejoining of lengths of homologous DNA. There is always at least one recombination event per chromosome pair so that a chromosome in the haploid gamete's genome is a hybrid of the parental chromosomal pair.
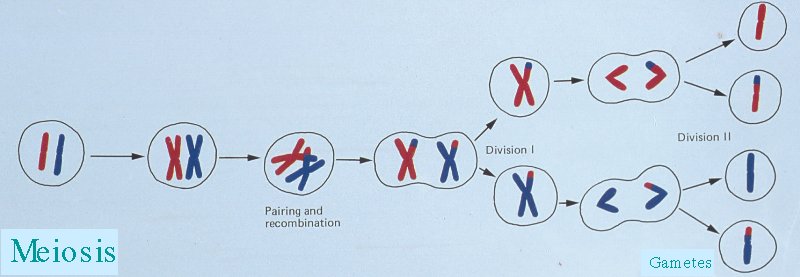
A haplotype is the pattern of variants observed at a set of polymorphisms along a section of a chromosome in a gamete. It can be used to infer where a recombination event fell on the chromosome (along with knowledge of the parental haplotypes).
If a new functional mutation occurs in an individual, and is subsequently propagated from generation to generation, then a particular ancestral haplotype of neighbouring polymorphisms will be associated with that new variant. The haplotype will become shorter with time, due to recombination, and unclear, due to mutation.
This is helpful, in that one does not have to genotype at the mutation itself to infer whether or not they carry a particular variant.
This is unhelpful, in that polymorphisms may be risk factors for a disease without being causative.
Population genetics (and evolutionary genetics) deal with occurence of genetic variation in groups of organisms and families, usually natural populations.
For a codominant trait, we can take a sample from the population, and count the different genotypes.
| Blood Group (genotype) | M (MM) | MN (MN) | N (NN) | Total |
|---|---|---|---|---|
| Count (percent) | 363 (28.4%) | 634 (49.6%) | 282 (22.0%) | 1279 (100.0%) |
The proportions are our best estimate of the probability that an individual will carry that genotype in the population of London, Oxford and Cambridge. The observed heterozygosity is 49.6%.
We can also make inferences about the population of gametes that gave rise to individuals tested:
| Alleles | M | N | Total |
|---|---|---|---|
| Count (percent) | 1360 (53.2%) | 1198 (46.8%) | 2558 (100.0%) |
The proportions are our best estimate of the probability that a sperm or egg taken from that population will carry that particular allele.
Hardy-Weinberg equilibrium describes the relationship between the gametic or allele frequencies, and the resulting genotypic frequencies. It holds if the following properties are true for the given locus,
If these properties hold, then the probability that two gametes will meet and give rise to a new genotype is simply the product of the allele frequencies (a la binomial):
| Pr(MM)= Pr(M) x Pr(M) |
| Pr(NN)= Pr(N) x Pr(N) |
| Pr(MN)= 1 - Pr(MM) - Pr(NN) = 2 x Pr(M) x Pr(N). |
We can easily test for deviation from Hardy-Weinberg equilibrium using a chi-square. This can arise from,
Coalescent models (branching linear birth-death process models)
For a neutral mutation in a population of constant size:
t = 2 N p
In the case of an exponentially expanding population or one where the mutant allele is undergoing selection,
t = log(2Np(r+s) + 1)/(r+s)
where r is the exponential growth rate parameter (approximately the proportional increase per generation), and s is the selection coefficient for heterozygotes.
A well-known example of such a calculation is for idiopathic torsion dystonia (locus DYT1) among the Ashkenazi Jews [Risch et al 1995]. In Eastern Europe, this population increased rapidly in size from approximately 105 in 1650 to 5 x 10⁶ in 1900, giving us an estimated r of 0.40. Risch et al [1995] estimate the allele frequency in the current population at 1/6000 to 1/2000. This gives an estimate of the age of the first mutation at 16-19 generations ago (about the year 1550).
Discrete variation within genes gives rise to altered type of gene product or altered level of gene product, and thus to a measurable human phenotype. Since both alleles of a diploid genotype in humans are usually active, a combined outcome is observed. The effects of the two alleles may interact in a nonlinear fashion (genetical dominance).
| R305W | R419Q | Blue | Green/Hazel | Brown |
|---|---|---|---|---|
| R/R | R/R | 48.9% (517) | 29.3% (310) | 21.8% (230) |
| R/R | R/Q | 26.5% (54) | 45.1% (92) | 28.4% (58) |
| R/R | Q/Q | 0% (0) | 57.1% (4) | 42.9% (3) |
| R/W | R/R | 47.6% (60) | 17.5% (22) | 34.9% (44) |
| R/W | R/Q | 30.0% (3) | 50.0% (5) | 20.0% (2) |
In the usual case where diploid genotypes are measured, haplotypes must be inferred via statistical modelling.
Genetic association refers to the direct genotype-phenotype relationship.
The use of the term is to differentiate it from genetic linkage, which refers to within-family cosegregation of genotype with phenotype arising due to colocalization on the same chromosome.
It can be detected in conventional epidemiological designs such as a case-control or cohort design, as well as in family based designs, which are complex matched (or counter-matched).
A Genome wide association study is such a study testing for association between a phenotype and a large number of marker polymorphisms.
A candidate gene association study will test for association between a phenotype and polymorphisms within a gene that is likely to be related to that phenotype, based on biochemical or physiological evidence.
| 
|
| 
|
| 
|
|
| 
|
| 
|
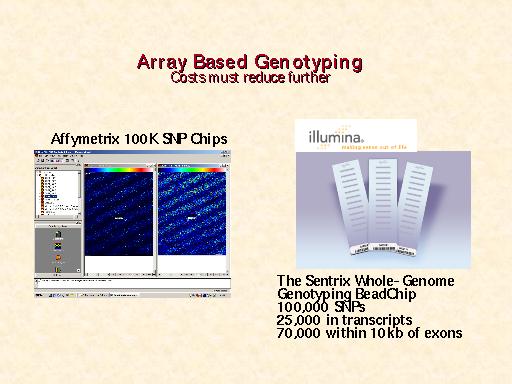
The GeneChip Mapping 100K Set is the first in a family of products for whole-genome association studies. It is comprised of a set of two arrays that enable genotyping of greater than 100,000 SNPs with a single primer.
The high throughput and ease of use of the Mapping 100K Set at a cost of one cent per SNP make whole-genome association feasible. It is usable for cancer genetics, linkage disequilibrium, case-control, family-based association studies, chromosomal copy number change analysis, and population genetics.
| A 250K set is currently undergoing testing.
|
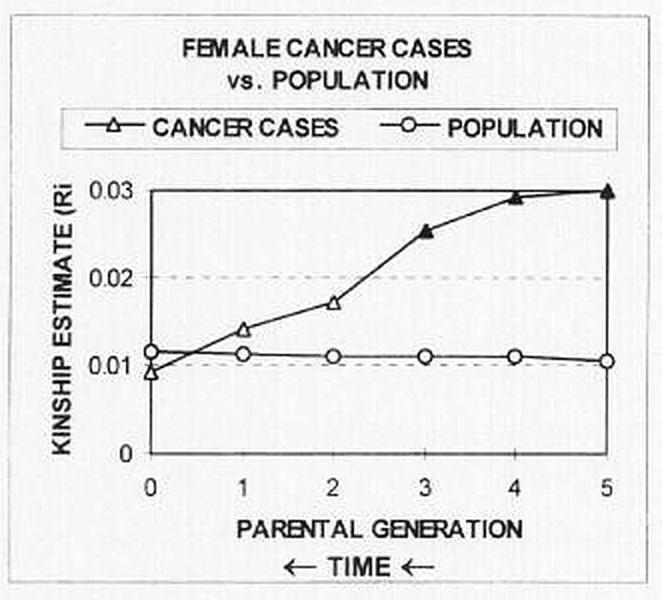
Ancestral kinship and cancer on Lastovo Island, Croatia [Rudan 2001]:
Tambs et al [1992] collected blood pressure measurements and familial relationships for 74994 Norwegians:
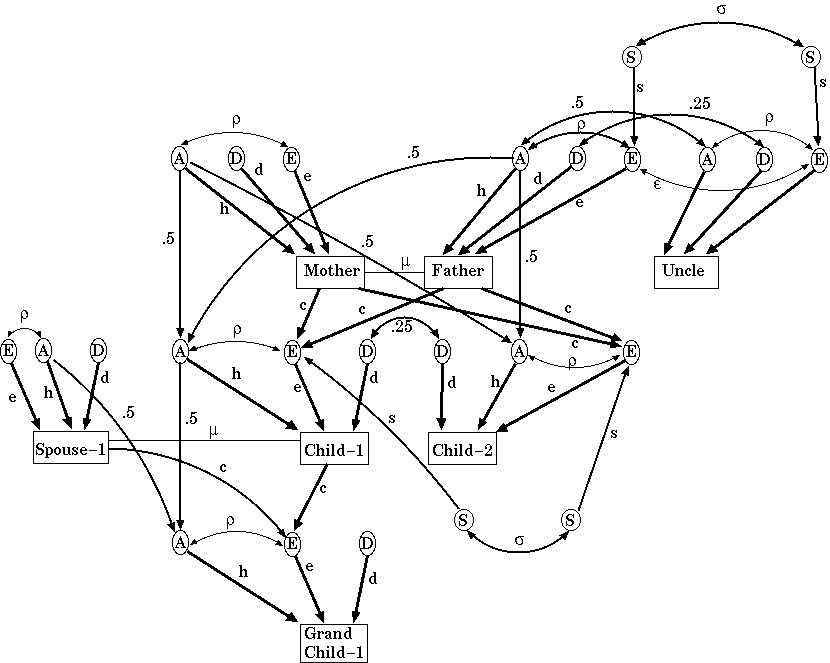
They concluded 47% of the variation in systolic BP was genetic, only 2% is due to shared family environment and 51% is due to unshared environment.
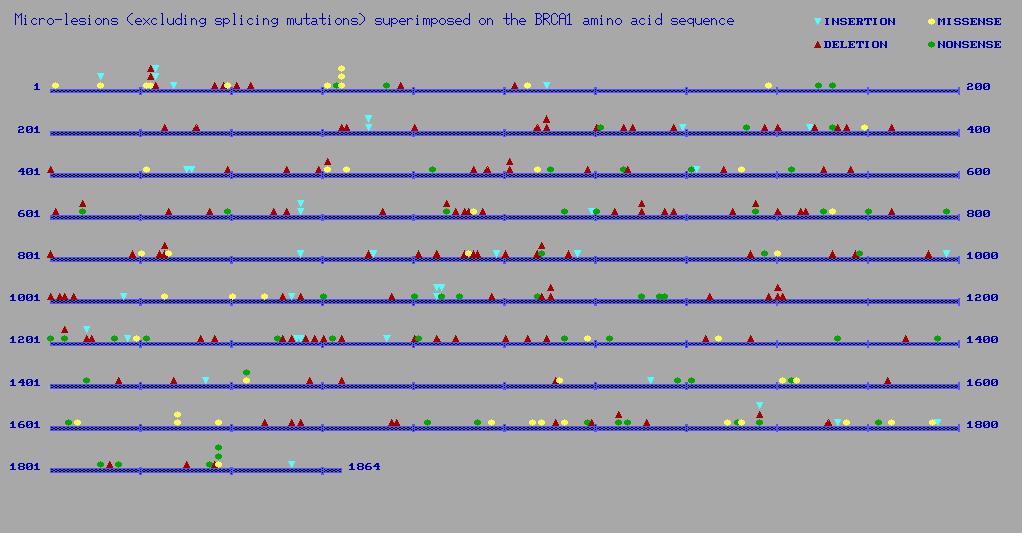
The Human Genome Mutation Database lists 347 known mutations in BRCA1:
In humans, asthma has been reported associated with variants in:
ADA ADAM33 ADRB2 ALOX5 BCL6 C3 CASP10 CFTR CYSLTR2
DCP1 DPP10 ELF5 FCER1B FCER2 Gm GPRA HLA Hp
IFNG IL4 IL4R IL9 IL10 IL12B IL13 IL18 LTC4S PAFAH
PHF11 PLA2G2D PTGDR SCYA5 SPINK5 TCRAD TGFB TLR4 TNFA UGB UGRP1
The relative risks associated with particular alleles for complex diseases are seldom much above two-fold.
| ID Disease/outcome | Gene (polymorphism), contrast | Sample size* | OR (F) (95% CI) | OR (R) (95% CI) | p Het | (number of studies) | |
|---|---|---|---|---|---|---|---|
| 1 Myocardial infarction | ACE (insertion/deletion), DD vs DI+II | 18 664 (15) | 1�20 (1�10�1�31) | 1�28 (1�09�1�50) | 0�001 | ||
| 2 Ischaemic heart desease | ACE (insertion/deletion), DD vs DI+II | 21 876 (17) | 1�16 (1�08�1�25) | 1�20 (1�06�1�36) | 0�004 | ||
| 3 ICVD | ACE (insertion/deletion), DD vs DI+II | 11 394 (6) | 1�18 (1�01�1�37) | 1�21 (0�98�1�50) | 0�187 | ||
| 4 Poor clozapine response | HTR2A (102T/C), CC vs CT+TT | 733 (6) | 1�64 (1�18�2�28) | 1�65 (1�19�2�29) | 0�514 | ||
| 5 Poor clozapine response | HTR2A (H452Y), YY vs HY+HH | 676 (5) | 5�55 (1�15-26�8) | 3�37 (0�97�11�6) | 0�941 | ||
| 6 Vascular disease | MTHFR (677C/T), TT vs CC | 6947 (23) | 1�08 (0�95�1�22) | 1�12 (0�92�1�37) | 0�001 | ||
| 7 Lung cancer | CYP2D6 (deficient oxidation), | 5162 (14) | 0�67 (0�53�0�84) | 0�63 (0�42�0�93) | 0�013 | ||
| poor metabolisers vs others | |||||||
| 8 Dementia in Down's syndrome | APOE (2/3/4), allele 2 vs 3+4 | 1130 (9) | 0�41 (0�22�0�78) | 0�45 (0�17�1�17) | 0�044 | ||
| 9 Schizophrenia | DRD3 (Bal1), 11+22 vs 12 | 5121 (25) | 1�07 (0�95�1�20) | 1�08 (0�95�1�23) | 0�204 | ||
| 10 Bipolar affective disorder | MAOA (Fnu4HI), allele 1 vs 2 | 962 (3) | 1�30 (0�96�1�75) | 1�42 (0�82�2�46) | 0�052 | ||
| 11 Bipolar affective disorder | MAOA (CA), allele 122 vs others | 1932 (7) | 0�95 (0�75�1�21) | 0�95 (0�69�1�31) | 0�115 | ||
| 12 Bipolar affective disorder | TH (tetranucleotide repeat), allele 1 vs others | 2901 (8) | 0�92 (0�78�1�08) | 0�97 (0�74�1�26) | 0�019 | ||
| 13 Unipolar affective disorder | TH (tetranucleotide repeat), allele 1 vs others | 1128 (3) | 1�17 (0�91�1�51) | 1�17 (0�91�1�51) | 0�370 | ||
| 14 NIDDM | KCNJ11/KIR6.2-BIR (E23K), KK vs EK+EE | 888 (4) | 1�94 (1�30�2�88) | 1�93 (1�29�2�87) | 0�777 | ||
| 15 Lung cancer | GSTM1 (gene deletion), null/null vs others | 9724 (21) | 1�17 (1�07�1�27) | 1�18 (1�04�1�34) | 0�007 | ||
| 16 Lung cancer | CYP1A1 (4889A/G), GG vs AA+AG | 2392 (6) | 1�45 (0�80�2�62) | 2�07 (0�71�6�08) | 0�106 | ||
| 17 Lung cancer | CYP1A1 (MspI), +/+ vs others | 4263 (12) | 1�21 (0�87�1�70) | 1�26 (0�84�1�89) | 0�294 | ||
| 18 Myocardial infarction | SERPINE1/PAI-1 promoter (4G/5G), | 3381 (9) | 1�32 (1�15�1�52) | 1�55 (1�16�2�08) | 0�001 | ||
| 4G/4G vs 5G/5G | |||||||
| 19 Parkinson's disease | CYP2D6 (1934G-A), allele 4 vs others | 7029 (14) | 1�17 (1�03�1�32) | 1�18 (1�00�1�40) | 0�094 | ||
| 20 Essential hypertension | AGT (M235T), allele T235 vs M235 | 4698 (6) | 1�22 (1�06�1�42) | 1�44 (1�04�2�00) | 0�002 | ||
| 21 Cancer | HRAS/HRAS1 (rare alleles) | 8542 (24) | 1�91 (1�62�2�27) | 1�84 (1�54�2�21) | 0�364 | ||
| rare vs common alleles | |||||||
| 22 Left ventricular hypertrophy | ACE (insertion/deletion), allele D vs I | 8186 (12) | 1�08 (0�97�1�21) | 1�13 (0�95�1�33) | 0�085 | ||
| 23 Bladder cancer | NAT2 (slow acetylation alleles), | 5836 (20) | 1�38 (1�23�1�55) | 1�43 (1�20�1�71) | 0�010 | ||
| slow/slow vs others | |||||||
| 24 ICVD | APOE (2/3/4), allele 4 vs others | 3632 (9) | 1�71 (1�38�2�11) | 1�69 (1�37�2�09) | 0�449 | ||
| 25 Non�syndromic cleft lip | TGFA (TaqI), allele 2 vs 1 | 5272 (9) | 1�50 (1�23�1�82) | 1�58 (1�13�2�21) | 0�012 | ||
| 26 Alcoholism | DRD2 (TaqIA), allele A1 vs A2 | 3826 (15) | 1�50 (1�26�1�79) | 1�60 (1�19�2�15) | 0�002 | ||
| 27 Ischaemic stroke | ACE (insertion/deletion), DD vs DI+II | 2160 (6) | 1�42 (1�16�1�74) | 1�58 (1�11�2�25) | 0�022 | ||
| 28 Diabetic nephropathy | ACE (insertion/deletion), II vs ID+DD | 5393 (20) | 0�73 (0�63�0�83) | 0�68 (0�55�0�84) | 0�006 | ||
| 29 Neural tube defects | MTHFR (677C/T), TT vs CT+CC | 3880 (13) | 1�68 (1�38�2�05) | 1�67 (1�26�2�23) | 0�105 | ||
| 30 Neural tube defects | MTHFR (677C/T) mother, TT vs CT+CC | 1955 (8) | 1�95 (1�44�2�65) | 1�98 (1�46�2�68) | 0�844 | ||
| 31 Neural tube defects | MTHFR (677C/T) father, TT vs CT+CC | 950 (5) | 1�09 (0�62�1�93) | 1�15 (0�65�2�05) | 0�568 | ||
| 32 Ischaemic heart disease | APOE (2/3/4), | 8 962 (9) | 1�27 (1�14�1�42) | 1�39 (1�11�1�73) | 0�001 | ||
| 4/3+4/2+4/4 vs 3/3 | |||||||
| 33 Ischaemic heart disease | LPL (D9N), ND vs DD | 2 022 (3) | 1�37 (0�81�2�33) | 1�36 (0�80�2�32) | 0�861 | ||
| 34 Ischaemic heart disease | LPL (N291S), SN vs NN | 13 115 (4) | 1�15 (0�91�1�46) | 1�15 (0�91�1�46) | 0�996 | ||
| 35 Ischaemic heart disease | LPL (S447X), XS vs SS | 4067 (5) | 0�84 (0�70�1�00) | 0�84 (0�70�1�00) | 0�969 | ||
| 36 Alcoholic liver disease | CYP2E/CYP2E1 (RsaI), allele c2 vs others | 4178 (9) | 1�54 (1�04�2�30) | 1�41 (0�78�2�55) | 0�119 | ||
| 37 Myocardial infarction | FGB/FGB promoter (455G/A), AA vs GG | 1561 (3) | 0�68 (0�47�0�99) | 0�68 (0�47�1�00) | 0�839 | ||
| 38 Myocardial infarction | F5 (1691G/A), AA+AG vs GG | 5937 (12) | 1�29 (1�03�1�61) | 1�32 (1�03�1�70) | 0�336 | ||
| 39 Myocardial infarction | F2 (20210G/A), AA+AG vs GG | 5637 (7) | 1�11 (0�79�1�56) | 1�20 (0�80�1�80) | 0�281 | ||
| 40 Ulcerative colitis | IL1RN (86-BP DUP), carriers of 2 vs others | 2835 (8) | 1�23 (1�04�1�45) | 1�18 (0�88�1�57) | 0�011 | ||
| 41 CAD | ITGB3 (L33P), A2A2 vs A1A2+A1A1 | 17 315 (31) | 1�07 (1�00�1�14) | 1�10 (0�99�1�21) | 0�004 | ||
| 42 Fractures | COL1A1 (2046G/T), ss+Ss vs SS | 3580 (13) | 1�39 (1�17�1�65) | 1�43 (1�13�1�81) | 0�088 | ||
| 43 Bipolar disorder | DRD3 (Bal1), allele 1 vs allele 2 | 3392 (9) | 1�01 (0�87�1�16) | 1�01 (0�87�1�16) | 0�545 | ||
| 44 Parkinson's disease | MAPT (allele A0), allele A0 vs others | 2090 (5) | 1�53 (1�23�1�91) | 1�52 (1�22�1�90) | 0�445 | ||
| 45 Bulimia | HTR2A (1438G/A), allele A vs G | 1126 (3) | 1�32 (1�04�1�69) | 1�33 (1�04�1�69) | 0�427 | ||
| 46 Anorexia nervosa | HTR2A (1438G/A), allele A vs G | 3698 (7) | 1�36 (1�19�1�57) | 1�42 (1�05�1�93) | <0�001 | ||
| 47 Bladder cancer | GSTM1 (gene deletion), null/null vs others | 4724 (15) | 1�50 (1�32�1�71) | 1�54 (1�27�1�86) | 0�037 | ||
| 48 SLE nephritis | FCGR2A (R131H), RR vs RH+HH | 2801 (24) | 1�12 (0�93�1�35) | 1�11 (0�88�1�41) | 0�123 | ||
| 49 SLE | FCGR2A (R131H), RR vs RH+HH | 4708 (21) | 1�29 (1�12�1�48) | 1�29 (1�10�1�52) | 0�218 | ||
| 50 Parkinson's disease | COMT (V158M), MM+MV vs VV | 964 (3) | 1�31 (0�84�2�04) | 1�37 (0�68�2�76) | 0�097 | ||
| 51 Recurrent early pregnancy loss | MTHFR (677C/T), TT vs CT+CC | 1097 (6) | 1�37 (0�95�1�98) | 1�31 (0�78�2�20) | 0�146 | ||
| 52 Alzheimer's disease | MAPT (extended haplotypes), | 3377 (7) | 1�03 (0�89�1�19) | 1�03 (0�89�1�20) | 0�377 | ||
| H1H1 vs H1H2+H2H2 | |||||||
| 53 Alzheimer's disease | LPR/LPR exon3 (766 C/T), CC vs CT+TT | 4097 (8) | 1�37 (1�18�1�58) | 1�37 (1�08�1�73) | 0�021 | ||
| 54 IgA nephropathy | ACE (insertion/deletion), DD vs DI+II | 1774 (7) | 1�26 (1�02�1�55) | 1�26 (0�99�1�61) | 0�294 | ||
| 55 Heparin-induced | FCGR2A (R131H), RR vs RH+HH | 1939 (6) | 1�02 (0�81�1�29) | 0�81 (0�49�1�34) | 0�023 | ||
| thombocytopenia |
If ethnic groups differ in frequency of polymorphisms and environmental risk factors for a condition, confounding can occur. There are perhaps three published examples of marked confounding, and these usually require obvious levels of admixture in the study sample (eg African Americans, Pima Indians), or strong association of the marker to ethnicity (eg lactase deficiency genotype and origin within Europe).
There are a number of statistical methods to deal with this:
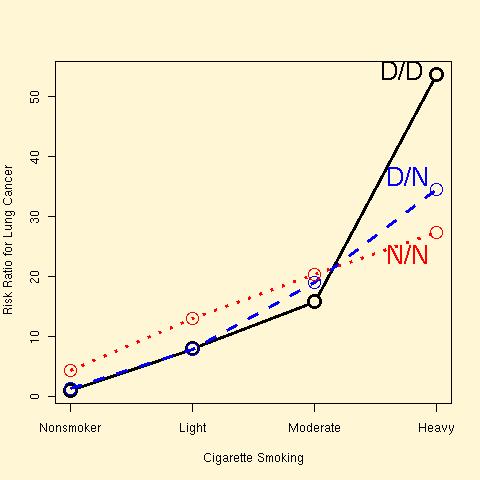
ERCC2 genotype, cigarette smoking and lung cancer risk in 2575 cases and controls [Zhou et al 2002]:
Epidemiologists are interested in using mendelian randomization to assess causation between observed phenotypes, using genotype as an instrumental variable.
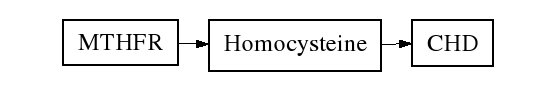
Minelli and coworkers (2004) note that metaanalysis of traditional epidemiological studies finds that a 3 uM (25%) decrease in serum homocysteine level is associated with an 11% decrease in coronary heart disease (CHD) risk.
The 677C>T transversion in the MTHFR gene is associated with higher homocysteine levels, therefore an increase in CHD risk would be expected if the direction of causation runs from homocysteine level to CHD, and MTHFR genotype has no other associations with CHD risk.
| Homocysteine level | CHD Odds Ratio | |
| MTHFR C/C v T/T | 2.7 uM (2.02-3.41) | 1.21 (1.06-1.40) |
So predicted Odds Ratio for CHD per 3 uM increase homocysteine level 1.24 (1.06-1.49).
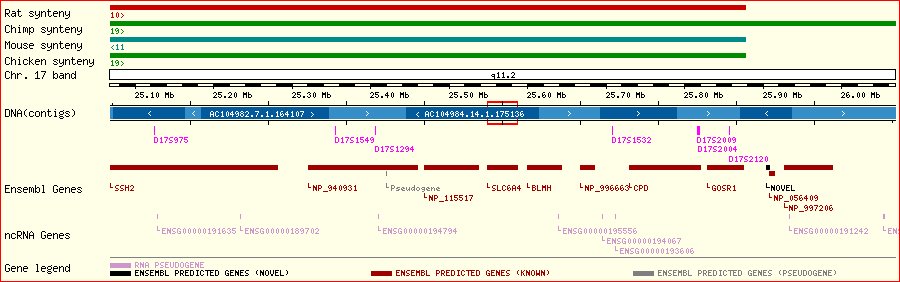
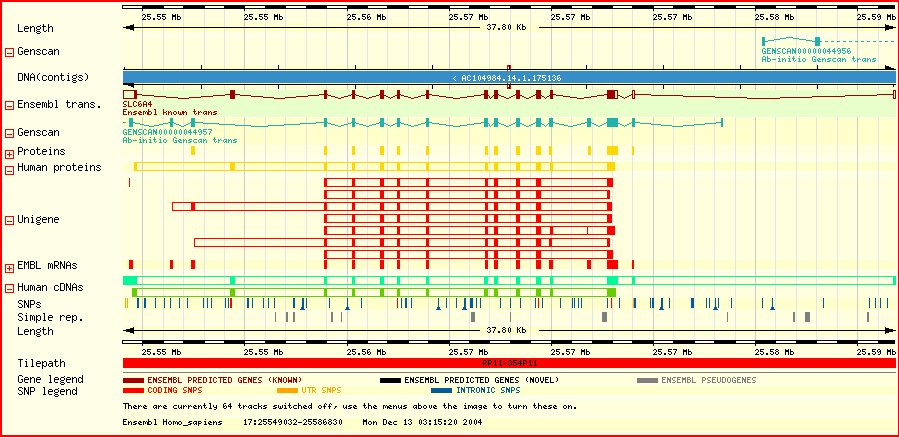
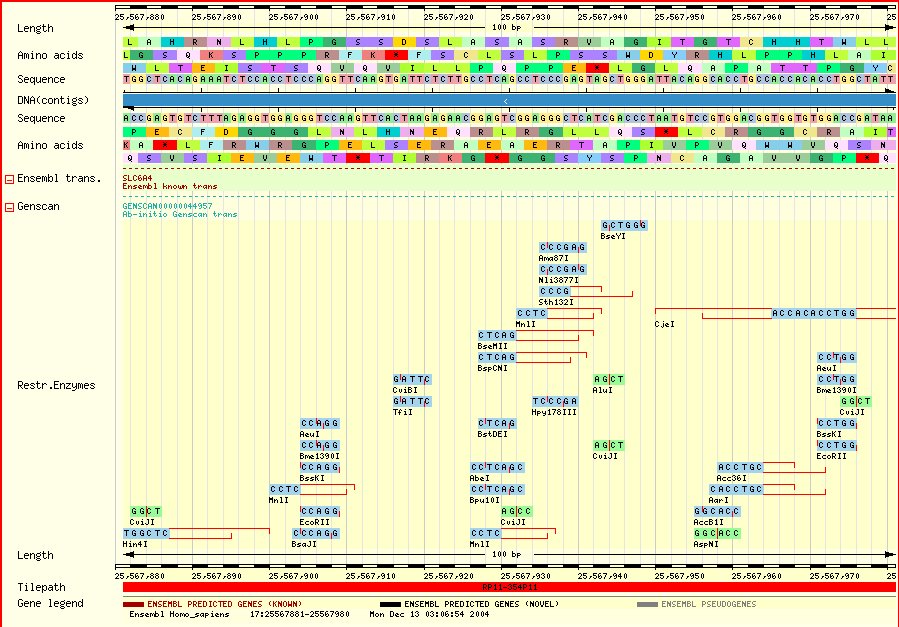
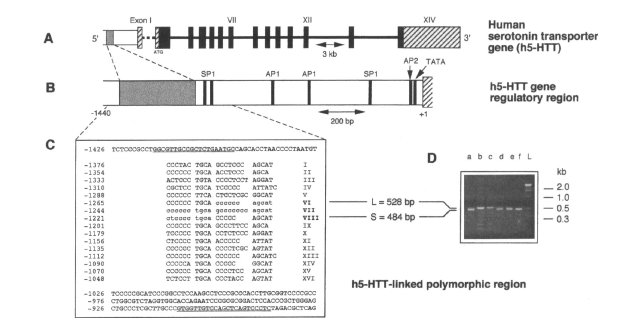
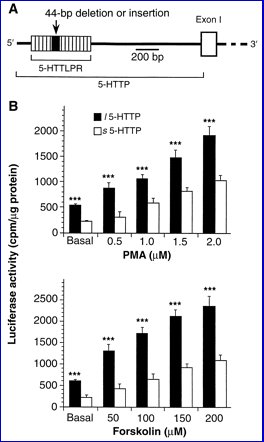
| There is a common VNTR polymorphism in the promoter of the serotonin transporter gene. SLC6A4-promoter/luciferase reporter construct is expressed at higher levels if the 42 bp insertion ("long") is present [Heils et al 1994; Lesch et al 1996]. | |
| 
|
Given the effects of drugs on the serotonin transporter, it seemed likely that there may be phenotypic effects of this polymorphism on behaviour:
| Trait Anxiety | Major (unipolar) Depression | ||
|---|---|---|---|
| Genotype | N | Neuroticism Score (NEO) | |
| L/L | 648 | 48.5 | 
|
| S/L | 1133 | 50.6 | |
| S/S | 751 | 50.3
| |
The "Short" allele weakly increases anxiety (0.2 SD) and risk of major depression.
| Bipolar Disorder | Violent Suicide | ||
|---|---|---|---|
| 
| ||
The "Short" allele weakly increases risk of bipolar disorder and violent suicide.
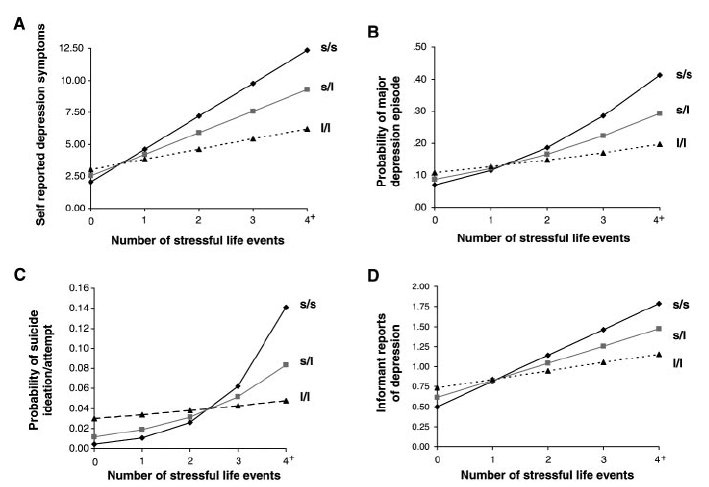
Caspi and coworkers reported a study of the SLC6A4 promoter insertion-deletion in the Dunedin Multidisciplinary Health and Development Study cohort.
They argued that the weakness of the association might hide larger effects in different environments, and cite animal models.
For instance, in rhesus monkeys, the short allele predicts low CSF serotonin metabolite levels (5-HIAA), but in deprived (peer-reared) and not in maternally reared monkeys [Bennett et al 2002]. A similar interaction is seen for ACTH response to stress [Barr et al 2004].
Genotyped 847 Caucasians followed to age 26 (265:435:147):
Measured stressful life events from ages 21-26 (life-history calendar):
Assessed childhood maltreatment
Assessed depression in last 12 months (Diagnostic Interview Schedule)
Predicted values from fitted interaction models
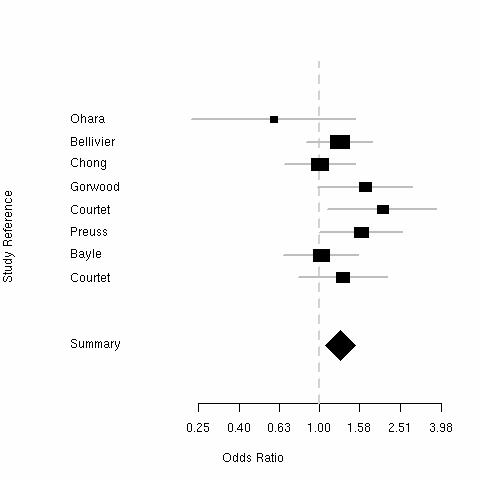
Marginal effects of promoter genotype
on risk of recent major depression
| Genotype | Odds Ratio |
| L/L (31%) | 1 |
| S/L (51%) | 1.16 (0.88-1.53) |
| S/S (18%) | 1.35 (0.78-2.33) |
Moderation by promoter genotype of
association of depression with life events.
| Genotype | Odds Ratio (per life event) |
| L/L (31%) | 1.13 (0.83-1.56) |
| S/L (51%) | 1.47 (1.08-2.02) |
| S/S (18%) | 1.68 (1.22-2.30) |
| Kaufman et al [2004]: Depression score in children taken into care (N=57) versus controls (N=44). |
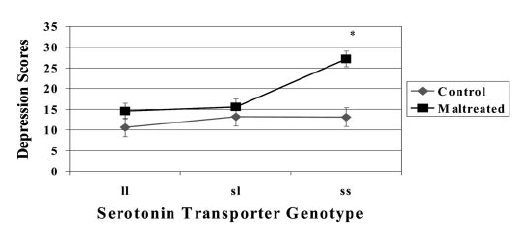
|
| Grabe et al [2004]: Distress (BL-38 scale) versus chronic disease and promoter genotype in Pomeranian women (N=674). |
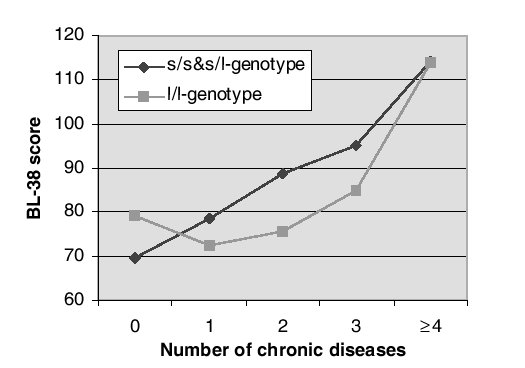
|
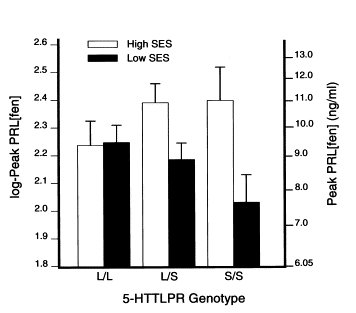
| Manuck et al [2004]: Prolactin level following fenfluramine administration versus SES and SLC6A4 promoter genotype (N=139). |
|
The frequency of the "short" allele varies across populations.
| Group | N | Proportion s |
|---|---|---|
| Asian | 1102 | 0.77 |
| Askenazi Israelis | 224 | 0.52 |
| UK | 686 | 0.43 |
| European Americans | 221 | 0.43 |
| Italy | 1104 | 0.41 |
| African Americans | 797 | 0.26 |