| Class | Global |
| Name | summary |
| Arguments | [<N highest results> | plot [qq] [<EPS file>] | table] | dump [<output file>]| get <variable_name>]. |
List the N (defaulting to 5) most significant P-values from the last multilocus analysis.
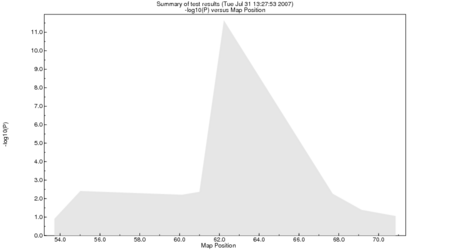
If the plot keyword is issued, a Postscript plot of the -log10 P-values versus map position of the active marker loci tested for association or linkage in the last analysis, unless the qq modifier keyword is present. In that case, a quantile-quantile plot of the -log10 P-values is produced. This is saved to a file (default name "sib-pair.eps").
For the table modifier keyword, a table of binned P-values or test statistics is produced; usual bin sizes are powers of ten.
The dump modifier prints all the P-values to a file.
The get <varname> modifier extracts numerical values from locus annotations taking the form varname=value, or from the i'th column. Reading VCF files usually transfers INFO variables to the annotations as such a pair. As a side effect, the variable is now available to select loci using "keep/drop where test".
Example:
>> include cavanaughex.in
>> apm ibd
>> summary

Test: "apm ibd".

Total number of tests =      8

Locus          Position  P-value   -log10(P)
-------------- --------- -------  ----------
D16S411            62.23  5e-12       11.286  48294236 (chr 16)
D16S409            61.00  0.0027       2.571  47333369 (chr 16)
D16S753            60.12  0.0027       2.562  31181005 (chr 16)
D16S3145           55.01  0.0036       2.446  26784604 (chr 16)
D16S419            67.69  0.0082       2.087  51510863 (chr 16)

>> summary 10

Locus          Position   P-value   -log10(P)
-------------- ---------- -------  ----------
D16S411             62.23  5e-12       11.286  48294236 (chr 16)
D16S409             61.00  0.0027       2.571  47333369 (chr 16)
D16S753             60.12  0.0027       2.562  31181005 (chr 16)
D16S3145            55.01  0.0036       2.446  26784604 (chr 16)
D16S419             67.69  0.0082       2.087  51510863 (chr 16)
D16S415             69.15  0.0483       1.316  52228236 (chr 16)
D16S771             70.85  0.1120       0.951  53066505 (chr 16)
D16S769             53.71  0.1297       0.887  26066263 (chr 16)


>> summary tab

Bin     Count  Percent
------- -----  -------
10^-11      1    12.5
10^-8       0     0.0
10^-7       0     0.0
10^-6       0     0.0
10^-5       0     0.0
10^-4       0     0.0
10^-3       0     0.0
10^-2       4    50.0
10^-1       1    12.5
10^0        2    25.0


>> summary plot
>> $ gv sib-pair.eps &
Resulting plot:
>> read loc vcf chr22.dose.vcf.gz
[...]

VCF file           = chr22.dose.vcf.gz
Number of subjects = 1370 (with genotype data)
Number of markers  = 365643
Number passing QC  = 365531 (1.000)
Number indels      = 18541
Number SVs         = 0
Total genotypes    = 500930910
Chromosome         = 22
Map range (bp)     = 16050408 -- 51242613

Declaring 365643 loci.

>> summary get R2
>> sum tab

Test: "R2".

 Intvl Midpt    Count   Histogram
 ---------------------------------------------------------
       0.0500  252665 + **************************************************
       0.1501   37201 | **********
       0.2501   21433   *****
       0.3501   14206   ***
       0.4502   10285   **
       0.5502    7858   **
       0.6502    6571   *
       0.7503    5289   *
       0.8503    4365   *
       0.9504    5352   *
Median (IQR)         =        0.0224 (       0.0024 --        0.1484)
Symmetry test J(.02) =        2.7801 (P=0.000)

>> keep where test >= 0.8
Selecting markers where test statistic >=   0.80000000000000004
Keeping 9736 active loci.
| << (mztwin) | Up to index | >> (homoz) |