| Class | Analysis and data manipulation command |
| Name | plot |
| Arguments | <quantitative|binary trait> <quantitative trait> <categorical trait> [<eps_file>]. |
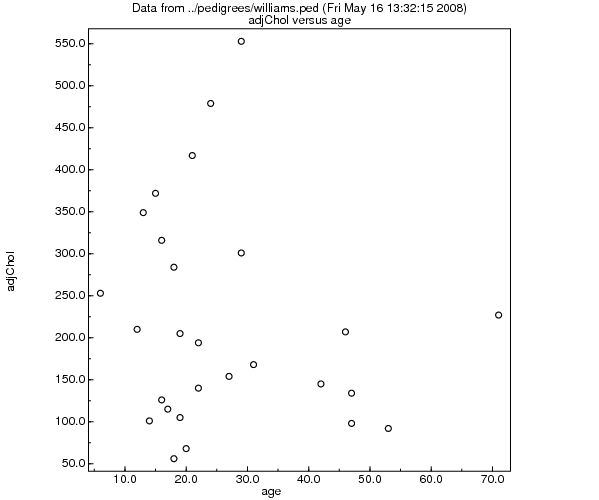
Produce an Encapsulated Postscript scatterplot for two quantitative traits. A binary trait is scored as n=1 and y=2 for plotting purposes. If a third binary or quantitative trait is specified, then this controls the plot symbol used for each point. The trait values 1 to 10 are represented as:
circle=1, disc=2, square=3 upward_triangle=4 plus=5, diamond=6 cross=7 pentagon=8 downward_triangle=9 point=10
The graphic file name defaults to "sib-pair.eps".
Example:
#
# Take advantage of macros to enhance plot command
# in a windowing environment.
# Primitive is still callable as "plo"
#
>> macro plot
plot>  plo %1 %2 %%.eps
plot>  $ gv %%.eps
plot>  file delete %%.eps
plot> ;;;;
>> include williamsex.in
>> plot age adjChol
| << (count) | Up to index | >> (hist) |