Class | Analysis and data manipulation command |
Name | mds |
Arguments | <axis_trait_1> [...<axis_N> ] |
Performs classical (metric) multidimensional scaling of interindividual genetic distances. These are based on identity by state (IBS) sharing at all active marker loci across all pairs of active individuals in the dataset. Individuals have to be typed at at least 50% of the active markers to be included in the analysis. The distances are the usual:
dij = 1-mean(IBS sharing for individuals i and j) ,
which are then double-centred.
The number of dimensions output is controlled by the number of quantitative traits named in the command: each will contain the estimated coordinates for every individual on one of the dimensions. One use for these scores is to correct for population stratification in genome-wide association studies.
Example:
>> include linclex.in >> set locus pc{1 2} qua >> mds pc1 pc2 ------------------------------------------------ IBS marker sharing: first 2 principal components ------------------------------------------------ Pairwise mean identity-by-state sharing based on 1 to 3 markers. There are 66 potentially useful individuals. 1.000 0.500 1.000 0.500 0.500 1.000 0.500 0.500 1.000 1.000 0.500 1.000 0.500 0.500 1.000 0.667 0.500 0.167 0.167 0.500 1.000... Extracting principal components Writing loadings on first 2 components to: "pc1" "pc2". >> head ! f m s l o ! a o e i n D13S162 D13S160 D13S170 ! id t t x n e pc1 pc2 ! 1 1 x x m n n 2/4 1/5 5/9 -0.0256 0.0066 1 2 x x f n n 4/5 3/5 5/7 -0.0277 -0.0882 1 3 1 2 f y y 4/4 5/5 5/5 0.2296 -0.0353 1 4 1 2 m y n 4/4 5/5 5/5 0.2296 -0.0353 1 5 1 2 f n n 4/5 3/5 5/7 -0.0277 -0.0882 1 6 1 2 f n n 2/4 1/3 7/9 -0.1341 0.1207 1 7 1 2 f n n 2/4 1/3 7/9 -0.1341 0.1207 2 1 x x m n n 4/8 2/5 3/5 -0.0793 -0.0490 2 2 x x f n n 4/6 4/5 1/5 -0.0545 -0.1477 2 3 1 2 m n n 6/8 2/4 1/3 -0.2572 -0.0111
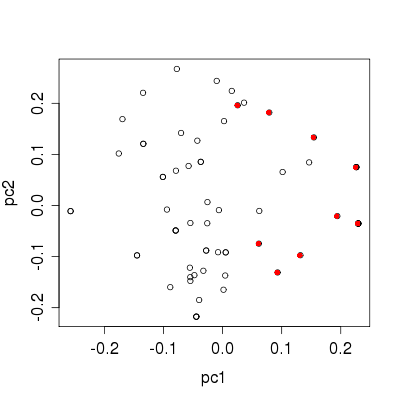
 >> plot pc1 pc2 |
Plot of MDS configuation on first two dimensions. The coloured points represent the cases.
|
<< (fstats) | Up to index | >> (dis) |
Class | Analysis and data manipulation command |
Name | pca ibs |
Arguments | <axis_trait_1> [...<axis_N>] |
Performs principal components analysis of interindividual genetic distances. These are based on identity by state (IBS) sharing at all active marker loci across all pairs of active individuals in the dataset.
The number of dimensions output is controlled by the number of quantitative traits named in the command: each will contain the estimated coordinates for every individual on one of the dimensions. One use for these scores is to correct for population stratification in genome-wide association studies.
<< (fstats) | Up to index | >> (dis) |